Domination
Which house do you want:

Lets do it again. Given Fig4 of this paper what options would you reject?
Congraulations, you've just worked out how to do multi-objective optimization
- Build Popluation[ i=0 ] by making lots of guesses
- Experiment: (mutate, cross over)
- Select the best results (a.k.a know as find the Pareto frontier)
- Set Population[ i+1 ] to the frontier.
- Goto step1
"Give me the fruitful error any time, full of seeds, bursting with its own corrections. You can keep your sterile truth for yourself."
― Vilfredo Pareto
"For many events, roughly 80% of the effects come from 20% of the causes."
― Vilfredo Pareto
Domination measures:
Binary Domination
- X domiantes Y if better on at least one, and worse on none.
- Returns a boolean.
- Widely used. Often stops distinguishing things after 3+ goals.
- Insenstive to the size of the domnation

Indicator Domiantion
From Zitler 2004:
- X dominates Y if moving X to Y loses less than moving Y to X.
- To make the signal stronger, we shout the difference (raise it to some expendial power).
- To gauge the overall signal, we average across all goals
- To handle goal we want to minimize, maximize, we add a "w" constant (-1,1).
- Returns a number.
-
Better at distinguishing higher problems with 3+ goals, see Table8.
-
To rank rowX, I
- N=100 times (say), pick rowY at random.
- Q: Why not comapre to all rows?
- If indicatorDomiantes( X,Y ) then +1/N to rowX
- Then I add a new
domcolumn to the data, wheich we want to maximize. - see dom.html
- N=100 times (say), pick rowY at random.
For example, here are some rows of auto.csv:
  %cylinders   displacement         horsepower   <weight   >acceltn   model   origin   >mpg
  8           340:360              150:160      3609      8          70:70   1        10
  6           198:225              83:86        2587      16         70:70   1        20
  8           383:455              165:230      4425      10         70:70   1        10
  8           302:305              120:140      3449      10.5       70:70   1        20
  6           198:225              92:97        2833      15.5       70:70   1        20
  8           383:455              165:230      3850      8.5        70:70   1        20
  4           104:114              92:97        2372      15         70:70   3        20
  4           104:114              92:97        2375      17.5       70:70   2        30
  8           340:360              165:230      3693      11.5       70:70   1        20
  ....
From the first row, we see we want to minimize weight and maximize acceleration and mpg. From the other rows, we see that some discretizer has gotten to the displacement and horsepower values are replaced them with some string describing a range e.g.lo:hi = 340:360.
Here's the same data, with dom score added. Shown here are the 5 best and worst rows.
%cylinders  displacement  horsepower  <weight  >acceltn  model  origin  >mpg  >dom
8           383:455       165:230     4746     12        71:71  1       10    0
8           383:455       165:230     4951     11        72:73  1       10    0
8           383:455       165:230     4952     11.5      72:73  1       10    0
8           383:455       165:230     4955     11.5      71:71  1       10    0
8           383:455       165:230     5140     12        71:71  1       10    0
8           383:455       165:230     4354     9         70:70  1       10    0.01
8           383:455       165:230     4425     10        70:70  1       10    0.01
8           383:455       165:230     4464     11.5      71:71  1       10    0.01
8           383:455       165:230     4735     11        72:73  1       10    0.01
8           383:455       165:230     4906     12.5      72:73  1       10    0.01
..          ...           ...         ...      ..        ...    ...     ...   ...
4           85:91         69:72       2070     18.6      78:78  3       40    0.98
4           85:91         ?           1835     17.3      80:80  2       40    0.98
4           68:85         46:65       1825     18.6      77:77  2       40    0.99
4           68:85         69:72       1613     18        71:71  3       40    0.99
4           85:91         46:65       2335     23.7      80:80  2       40    0.99
4           85:91         46:65       1968     18.8      80:80  3       40    1.0
4           85:91         46:65       1975     19.4      81:81  3       40    1.0
4           85:91         46:65       1985     21.5      78:78  2       40    1.0
4           85:91         46:65       2085     21.7      80:80  2       40    1.0
4           96:97         46:65       2130     24.6      82:82  2       40    1.0
Observe that the highest dom scores are assocaited wiht rows with least weight, most acceleration and most mpg (and the lowest dom scores are associated with the reverse).
The Lay of the Land
The real story is that underneath surface features of all these problems is a common mathematical structure called, you guessed it, the landscape.
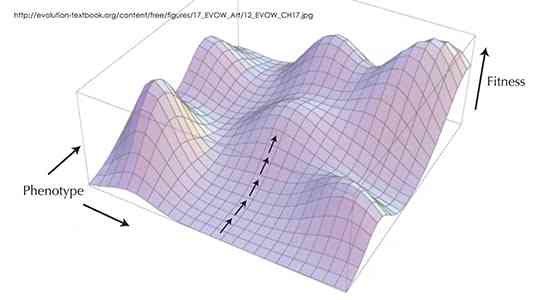
To know the landscape is to know how to optimize, how to avoid getting stuck on being over-adapted (hence overspecialized) on some local peak, when as Stewart Brand so aptly puts it...
- "Whole mountain ranges of opportunity could be glimpsed in the distance, but getting to them involved venturing 'downhill' into regions of lower fitness".
Studying such landscapes made Brand distrust claims for "optimality" since what you call "optimum" may actually be just a stepping zone to a better place.
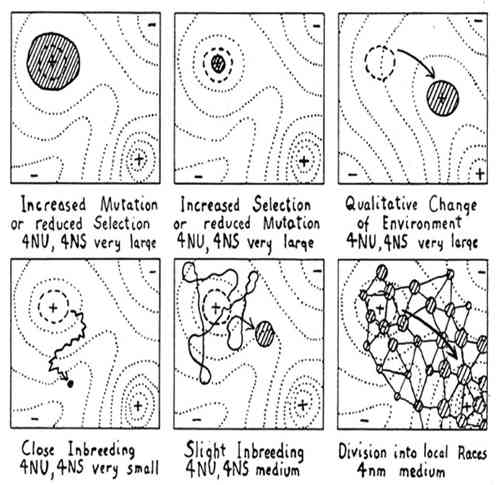
Brand's favorite landscape comes from a 1932 genetics paper that discusses how different breeding strategies respond well (or badly) to environmental pressures. In the following, the x-y axis might be "length of hair" and "body weight" and the z-axis might "probability of winning a fight".
Says Brand:
-
"The first two illustrate how low selection pressure or a high rate of mutation (which comes with small populations) can broaden the range of a species whereas intense selection pressure or a low mutation rate can severely limit a species to the very peak of local fitness. The third diagram shows what happens when the landscape itself shifts, and the population has to evolve to shift with it."
-
"The bottom row explores how small populations respond to inbreeding by wandering ineffectively. The best mode of exploration Wright deemed the final diagram, showing how a species can divide into an array of races that interact with one another. That jostling crowd explores well, and it can respond to opportunity."
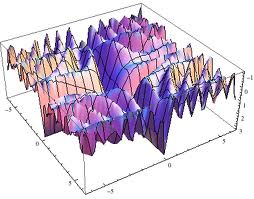
Holes, poles, saddles, local minima, flat, brittle
So to understand search, understand the landscape. If you know the landscape, you can see where it can trap and where it can help us out. One such trap is the saddle which, in the above diagram is the flat space between the mountain (called a pole) and the hole next to it.
Note that if walk along the saddle, you might think you are in a stable space of solutions. But be warned, one slip to the left or right and the landscape changes dramatically. In the above space you might fall into a hole or a pole.
Another trap is the local minima that seems like a good idea but if you get sucked into it, you may never find the much better place:
Another bad landscape is one that is completely flat. Try as you like, you walk along way around this one before finding anything better or worse:
The opposite of flat is bumpy:
Bumpy landscapes are common so Harman comments that understanding the neighborhood of our solutions is an open and pressing issue in search-based software engineering (SBSE):
- "In some software engineering applications, solution robustness may be as im-portant as solution functionality. For example, it may be better to locate an area of the search space that is rich in fit solutions, rather than identifying an even better solution that is surrounded by a set of far less fit solutions."
- "Hitherto, research on SBSE has tended to focus on the production of the fittest possible results. However, many application areas require solutions in a search space that may be subject to change. This makes robustness a natural second order property to which the research community could and should turn its attention."
Bumpy landscapes mean that, sometimes, to achieve better goals you may have to first give up some of your current achievements. In the history of A.I. this is also called Sussmann's anomaly- that sometimes the way to "better" is via "worse". There are many ways to "jump over" these anomalies. Sussman (and his supervisor, Marvin Minsky) believed that intelligence requires an exolicit list of exceptions or tricks and that any plan for making things better had better be auditted by a "debugging" system. That is a knowledge-full approach that requires some analyst to supply descriptions of "when to jump around". Alternate knowledge-less approaches are:
- Stochastic jumps using, say, simulated annealing;
- The retries mechanism discussed below;
- Momentum constants added to the mutators of stocahstic search. Such momentum constants resist sudden stops to the search: if a local maximum is reached, the momentum constant would push the inference a little further just to see if anything better lies beyond the current position. For example, in the following landscape, momentum would nudge the ball over that little lip into a better (and lower) world.
Which is best: knowledge-full or knowledge-less? Well, that depends on the nature of the problem, the intrinsic value of the knowledge, etc etc. But the general engineering trade-off is that knowledge-less approaches are faster to build and maintain, while the knowledge-full approaches perform comparatively better. FYI- I used to work on knowledge-full approaches but I have found my life to be easier since I switched to knowledge-less.
Walkting the Territory
A.k.a. multi-objective domination